Server
Overview
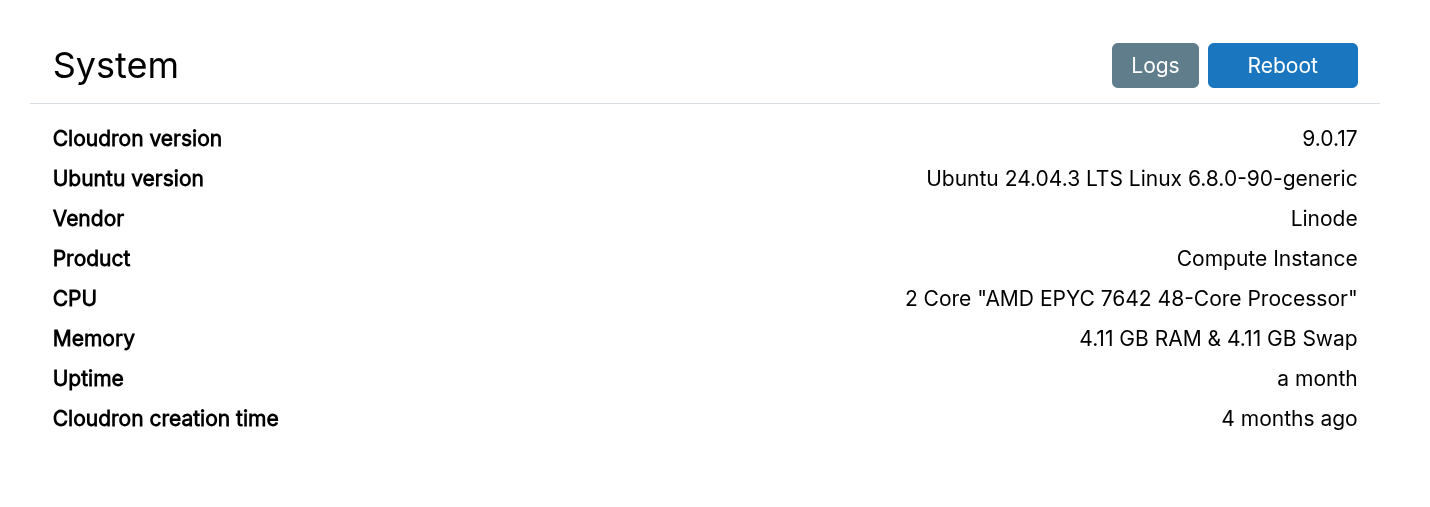
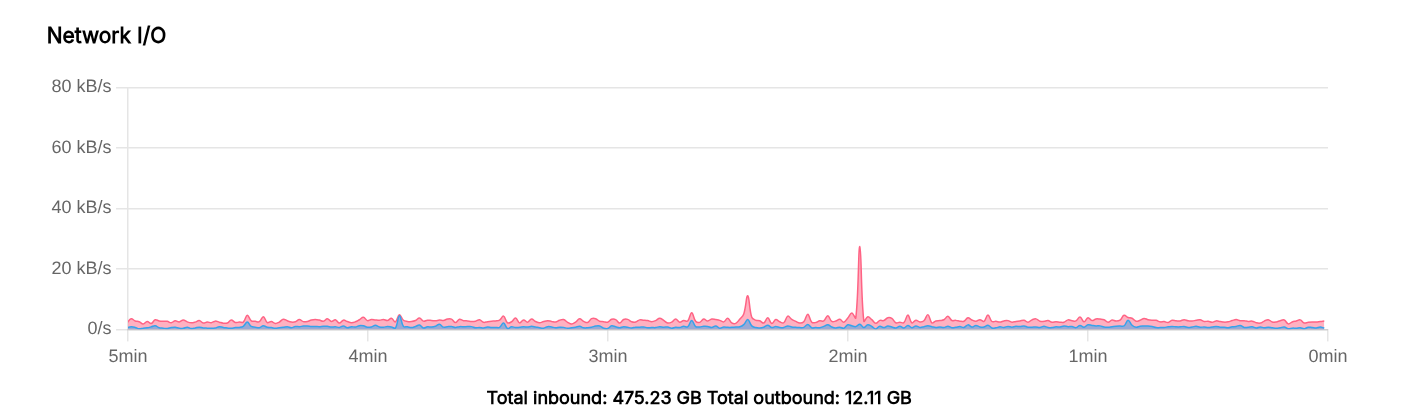
The System view gives an overview of the Server:
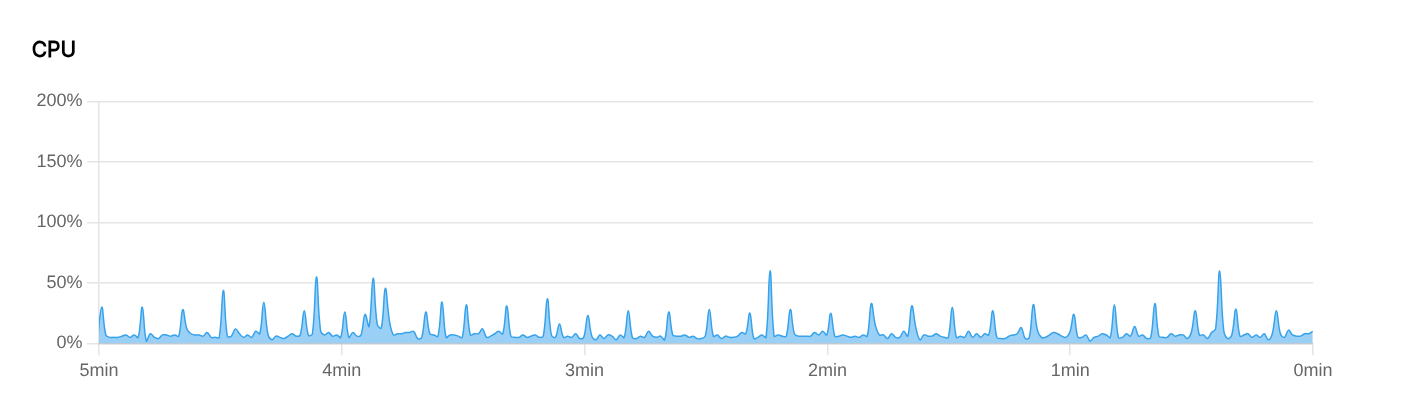
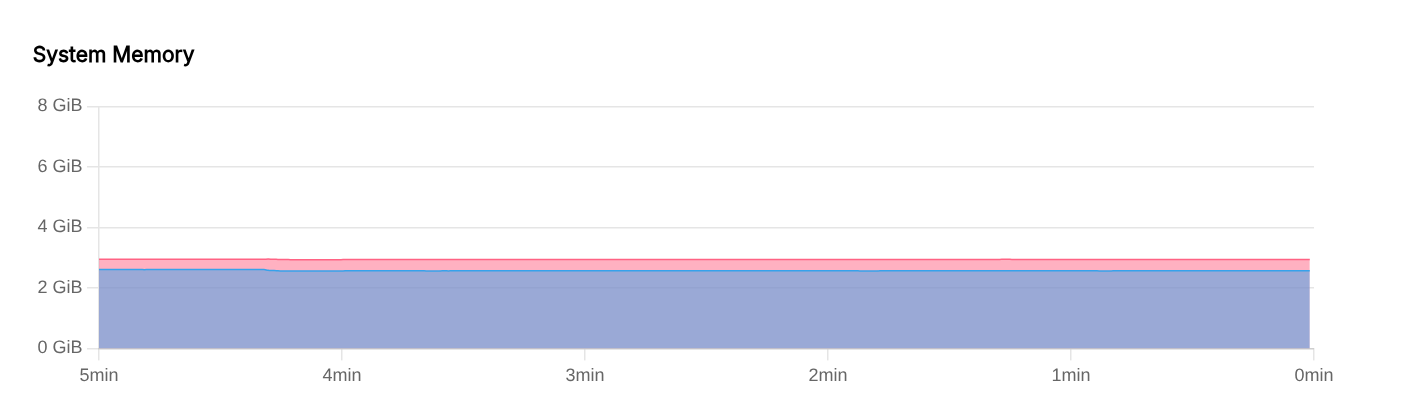
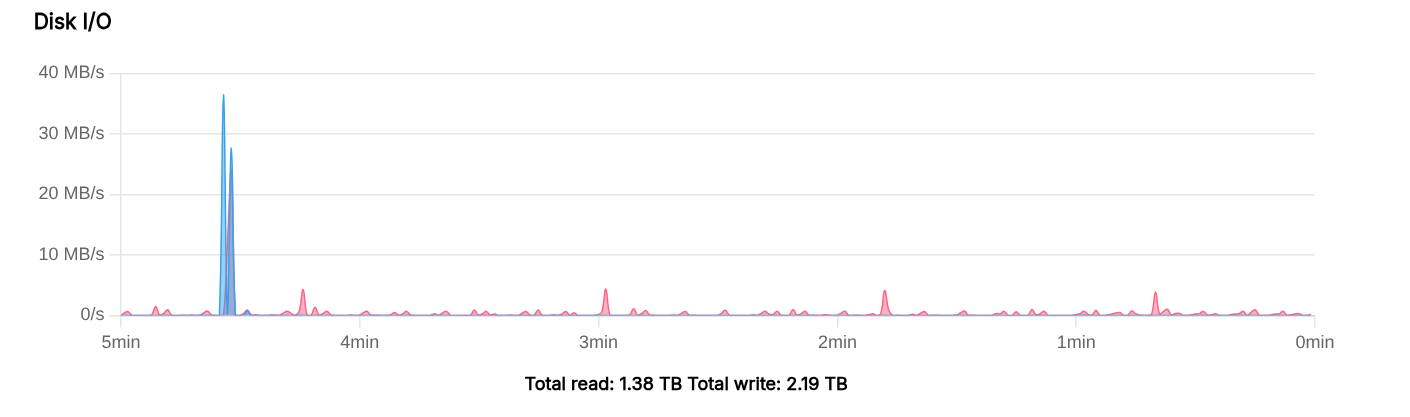
Realtime and historical graphs:
Logs
The raw logs are located at /home/yellowtent/platformdata/logs/box.log. Up to 10MB of active logs is kept alongside 5 rotated logs. Logs older than 14 days are removed.
Disk usage
Disk usage is computed on demand.
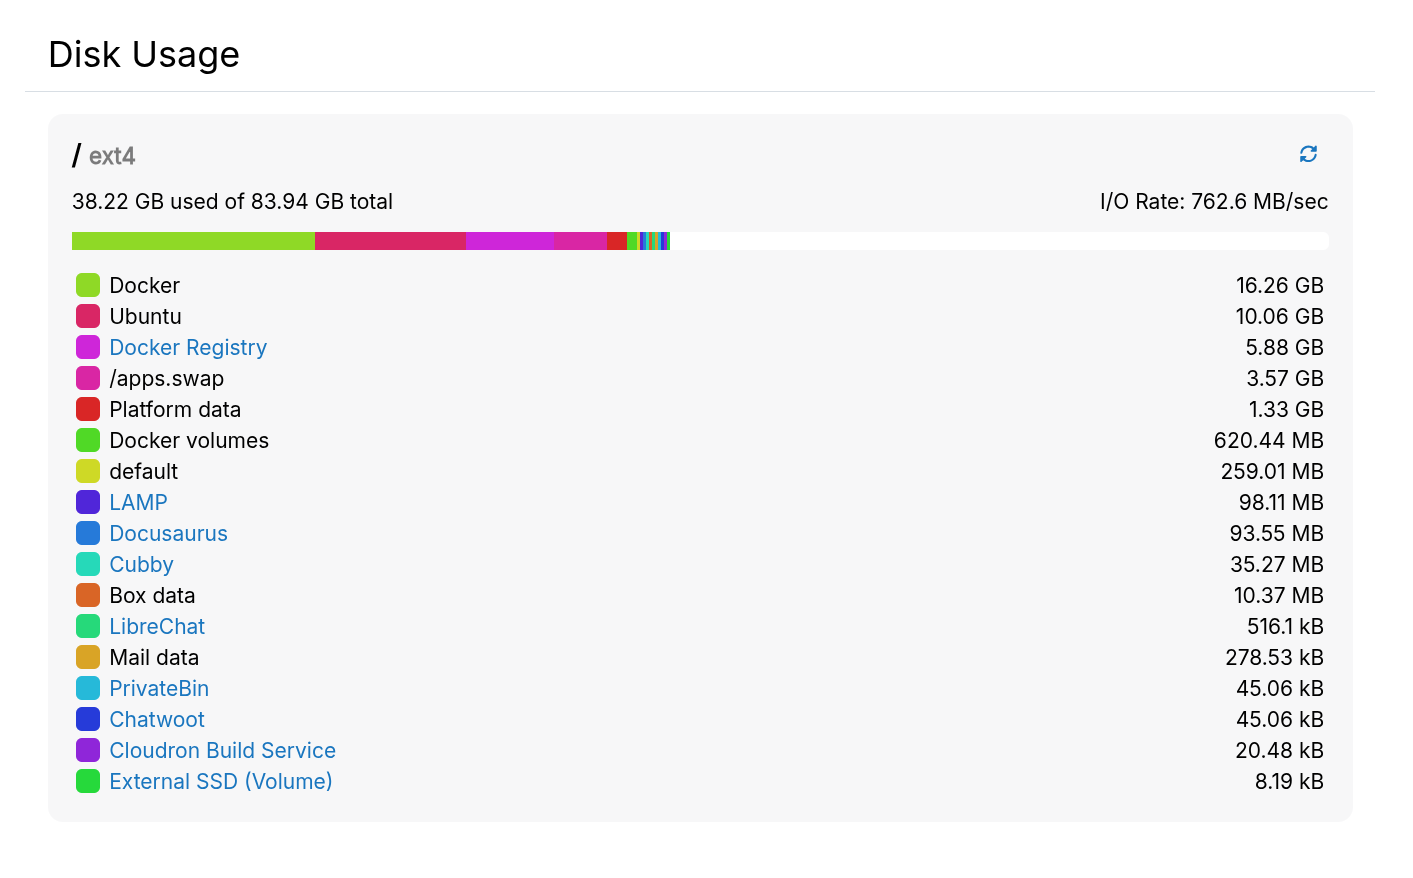
| Directory | Notes |
|---|---|
docker | Size of docker images. Docker images take around 10GB. In addition, app images vary greatly in size and each app is typically around 2GB. |
docker-volumes | Temporary data of apps. If this is large, find the offending app with `docker ps -q |
/apps.swap | System swap. Usually same amount as system RAM, but limited to 4GB max. |
boxdata | Platform code data. |
maildata | Email data. |
Everything else (Ubuntu, etc) | System packages. Use system tools like du to investigate if this is more than say 20GB |
platformdata | This contains logs, database directories (mysql, postgres, mongo, redis), and performance metrics. |
| App | Persistent data of app excluding database size |
If your disk is too slow, it can be excluded from periodic disk usage
collection. Add the filesystem path (must match df output) per line
to /home/yellowtent/platformdata/diskusage/exclude.
Server disk layout
Data and temporary/runtime data is sandboxed in /home/yellowtent (yellowtent was the code name).
The subdirectories are:
box- Contains the platform code. The platform code does not run as root.boxdata- Contains data generated by the platform, including certificates. Also stores all user emails in themail/vmaildirectory (maildir format).appsdata- Contains data generated by each app. Each subdirectory corresponds to an application ID.platformdata- Contains runtime data for MySQL, PostgreSQL, MongoDB, and nginx.
boxdata, appsdata and platformdata are relocatable.
The other important locations on the server are:
/var/lib/docker- Contains Docker images. This is relocatable./etc/nginx- Contains the reverse proxy configuration. Do not edit manually./apps.swap- A swap file dynamically resized by the platform (max 4GB). Resize after initial setup or truncate to 0 to disable swap.
Docker images
Do not use a Volume as storage location for Docker images. Set up fstab or systemd mount manually.
Docker images consume significant space and are stored at /var/lib/docker by default. To move them to external storage:
- Stop docker and the box code:
systemctl stop docker box
systemctl mask docker
- Create a systemd drop-in at
/etc/systemd/system/docker.service.d/custom.confto change the docker image location (e.g., to/mnt/docker):
[Service]
ExecStart=
ExecStart=/usr/bin/dockerd -H fd:// --log-driver=journald --exec-opt native.cgroupdriver=cgroupfs --storage-driver=overlay2 --data-root=/mnt/docker --experimental --ip6tables
- Start docker
systemctl daemon-reload
systemctl unmask docker
systemctl start docker
systemctl status docker
docker network create --subnet=172.18.0.0/16 --ip-range=172.18.0.0/20 --gateway 172.18.0.1 cloudron --ipv6 --subnet=fd00:c107:d509::/64
-
Edit
/home/yellowtent/platformdata/INFRA_VERSIONand bump only the last digit of theversionfield (e.g.,48.18.0to48.18.1). This signals the platform to re-create containers. -
Reboot the server. This is required for the
docker networkto work on many VPSes. -
On reboot, addons and app images are recreated while preserving existing data. This can take a while. Monitor progress with
tail -f /home/yellowtent/platformdata/logs/box.log. -
After everything is running, remove the old Docker images:
rm -rf /var/lib/docker
The du -hcs /var/lib/docker command often returns incorrect output with the overlay2 driver
due to how du works.
Use docker system df instead.
Apps are tested only with the overlay2 graph driver. Other storage drivers like devicemapper may cause issues.
Default data directory
Do not use a Volume as storage for the directories below. Set up fstab or systemd mount manually.
While symlinking directories works, it is not supported. Instead, move the Data Directory of high-storage apps to an external volume.
Create a complete backup before following this procedure.
Apps store data under /home/yellowtent/appsdata. Platform data (users, groups, certificates, emails) is stored under /home/yellowtent/boxdata.
To move these directories to another EXT4 disk:
    systemctl stop box
    systemctl stop cloudron-syslog
    systemctl stop docker
    systemctl mask docker
    DATA_DIR="/var/data"  # this is the external disk location
    mkdir -p "${DATA_DIR}"

    # (optional) move out apps data to the external disk
    mv /home/yellowtent/appsdata "${DATA_DIR}"
    ln -s "${DATA_DIR}/appsdata" /home/yellowtent/appsdata

    # (optional) move out box data to the external disk
    mv /home/yellowtent/boxdata "${DATA_DIR}"
    ln -s "${DATA_DIR}/boxdata" /home/yellowtent/boxdata

    # (optional) move out app database storage to the external disk
    mv /home/yellowtent/platformdata "${DATA_DIR}"
    ln -s "${DATA_DIR}/platformdata" /home/yellowtent/platformdata

    systemctl unmask docker
    systemctl start docker
    systemctl start cloudron-syslog
    systemctl start box
If the disk graph does not display properly, do a systemctl restart collectd.
The data directory must use an EXT4 filesystem.
Server resize
For VPS providers that support it, resize the server (CPU/disk/memory) and the system automatically adapts after a restart.
Some providers do not automatically resize the disk after enlargement. Check the disk size with:
df -h
For example, if disk /dev/sda was enlarged and /dev/sda1 is the data partition:
resize2fs /dev/sda1
Check your provider's documentation for detailed steps.
Some VPS providers change the IP address after a resize. Update DNS if this occurs.
AWS EBS
On AWS, resize the partition and filesystem after resizing the EBS volume. See the AWS Guide.
Swap
To add more swap space:
dd if=/dev/zero of=/extra.swap bs=1024 count=2097152
chmod 600 /extra.swap
mkswap /extra.swap
swapon /extra.swap
To persist the swap across reboots, add to /etc/fstab:
/extra.swap none swap sw 0 0