Guide: monitoring and alerting for Cloudron servers
Introduction
The lack of a built-in monitoring and alerting system challenges many Cloudron users. This guide provides a straightforward solution for setting up monitoring on your Cloudron servers. The goals include making the setup process simple, enabling notifications for alerts, handling multiple servers, and offering a freemium solution that starts free but scales with your needs.
This guide was contributed by the Cloudron Community, and does not imply support, warranty. You should utilize them at your own risk. You should be familiar with technical tasks, ensure you have backups, and throughly test.
- Contributor: AmbroiseUnly
- Discuss this guide
Solution: using Netdata
Netdata is a robust monitoring tool that meets all these requirements. It is simple to install and use, supports multiple servers, and provides immediate data visualization and alerting.
Installation steps
Follow these steps to install Netdata on your Cloudron server. The setup takes approximately 5 minutes:
- Create a Netdata Account: Sign up for a free account on Netdata.
- Add Your First Node: In your Netdata dashboard, navigate to
Deploy/Operating Systems/Linuxto add your first node. - Copy the Command Line: Netdata will provide a command line script (
wget...) for installation. - Execute the Command on Your Server: Connect to your Cloudron server via SSH and run the provided command.
- Follow Installation Prompts: Netdata will prompt you for confirmation to install as a background service.
- Verify Installation: Check your Netdata dashboard to ensure data is being collected and displayed.
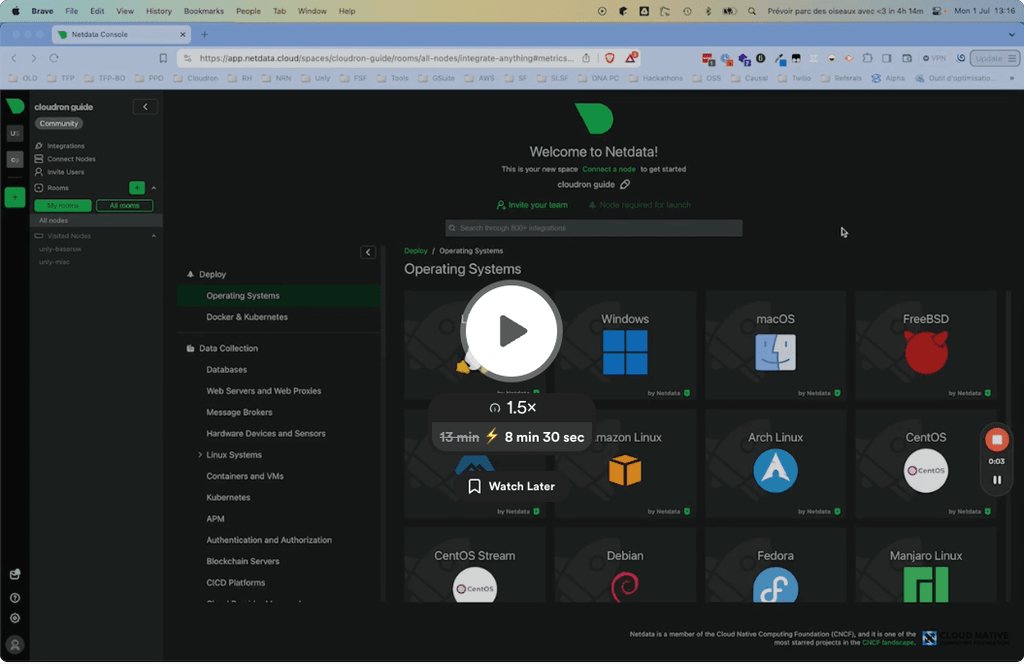
Video guide
For a detailed walkthrough, including a demonstration of the notification system, watch the following video guide:
Alternative solutions
Grafana
Grafana is another powerful open-source monitoring tool. However, it has a more complex installation and configuration process, which might be challenging for users unfamiliar with such setups. Many users, including myself, have found it difficult to configure the notification system in Grafana.
Custom scripts
Some community members have suggested using custom bash scripts for monitoring. This viable option requires significant maintenance and expertise. Specialized tools like Netdata offer ease of use and comprehensive features out of the box, making them preferable for non-sysadmin experts.
Conclusion
Netdata provides an efficient and user-friendly solution for monitoring Cloudron servers. Its simplicity, combined with robust features, makes it an ideal choice for users looking to set up monitoring and alerting quickly and effectively.